
ELA is supporting the academic community for the ninth time, assisting university candidates, students, researchers, higher education institutions, and public policy makers
The development of the Polish Graduate Tracking System (ELA) began in 2013, following changes to the Act on higher education and science. Launched in 2016 on behalf of the Polish Ministry of Science and Higher Education, ELA has been systematically refined since. Today it is recognised as one of the most innovative systems of its kind in Europe. ELA's solutions are being leveraged to develop tools that aid in tracking the careers of graduates across Europe.
The analyses conducted by ELA rely on administrative data from the POL-on higher education system and the registers of insured individuals maintained by the Polish Social Insurance Institution (ZUS). To ensure the privacy of individuals, all analyses and published results are anonymised in accordance with legal standards.
ELA has consistently provided information on various groups of the academic community in Poland since its initial release. While the early reports focused solely on the economic circumstances of graduates, current ELA analyses also include information on the educational and economic pursuits of students, PhD candidates, and those who have earned doctoral titles. With more than 800,000 new individuals included this year, the system provides a comprehensive overview of the educational and professional careers of nearly 7 million people who studied, graduated, or pursued doctoral programmes between 2014 and 2022.
The results of ELA are presented annually in the form of interactive infographics, automatic reports, and aggregated data sets, which include indicators at the national, institutional, and individual programme levels.
The ninth edition of ELA had its summer premiere on 9 July 2024. The latest edition features new results that outline the characteristics of graduates and individuals with doctoral titles. The results of the new edition that describe students and PhD candidates will be presented in autumn. Indicators that support universities’ efforts to be included in international rankings will also be provided later this year.
Below, you will find a selection of key findings from the ninth edition of ELA.
Selected results
Earnings and unemployment by province and powiat of residence
Provinces
Table 1 includes information on the earnings and unemployment of the 2022 cohort of graduates of master’s programmes (second-cycle programmes and long-cycle programmes) during the first year after the completion of their studies, by province of residence.
Table 1. Indicators that describe the earnings and unemployment of individuals who completed their master’s programmes in 2022
| Province | Earning median (PLN) | RER median | Risk of unemployment | RUR |
| Dolnośląskie | 5,381.29 | 0.75 | 3.0% | 0.83 |
| Kujawsko-pomorskie | 4,952.8 | 0.78 | 3.6% | 0.62 |
| Lubelskie | 4,737.5 | 0.76 | 6.4% | 0.93 |
| Lubuskie | 5,174.22 | 0.80 | 3.2% | 0.79 |
| Łódzkie | 5,220.97 | 0.80 | 3.4% | 0.63 |
| Małopolskie | 5,145.82 | 0.73 | 3.8% | 0.82 |
| Mazowieckie | 5,791.53 | 0.77 | 2.8% | 0.60 |
| Opolskie | 5,045.74 | 0.77 | 4.1% | 0.74 |
| Podkarpackie | 4,792.15 | 0.80 | 6.7% | 0.85 |
| Podlaskie | 4,697.55 | 0.73 | 5.7% | 0.92 |
| Pomorskie | 5,233.25 | 0.74 | 2.7% | 0.63 |
| Śląskie | 5,210.24 | 0.76 | 3.2% | 0.79 |
| Świętokrzyskie | 4,736.9 | 0.77 | 7.4% | 1.04 |
| Warmińsko-mazurskie | 5,012.22 | 0.82 | 4.8% | 0.80 |
| Wielkopolskie | 5,082.76 | 0.78 | 2.6% | 0.83 |
| Zachodniopomorskie | 5,078.05 | 0.77 | 4.1% | 0.76 |
Graduates residing in the Mazowieckie province reported the highest average earnings of PLN 5,791.53, while graduates from the Podlaskie province earned the least with an average of PLN 4,697.55. When evaluating the earning efficiency of graduates, it is crucial to factor in the general income levels in their areas of residence. This efficiency can be measured more accurately with the Relative Earnings Rate (RER). RER is the ratio between the average income of graduates and that in their places of residence during the monitoring period. RER considers the economic condition of the local labour markets during respective periods and allows to compare earning efficiency across various places of residence and monitoring periods. The RER values indicate what part of the local average income was earned by graduates. The highest RER values were reported for the graduates in Warmińsko-Mazurskie province who earned 0.82 of the average local income, while the lowest RER values were observed in the Małopolskie and Podlaskie provinces (0.73 in each of the provinces).
Similarly, we are able to compare the nominal and relative unemployment measures. The lowest risk of unemployment during the first year following graduation (measured as the average percentage of months during that period in which monitored graduates remained registered as unemployed) was recorded for the graduates in the Wielkopolskie province (2.6%), whereas the graduates in the Świętokrzyskie province were the most likely to become unemployed (7.4%). The Relative Unemployment Rate (RUR) compares the risk of becoming unemployed and the rate of unemployment in places where graduates reside. Similarly to RER, RUR allows to compare the resilience of monitored graduates to unemployment. The most resilient were the graduates in the Mazowieckie province (0.60), while the least resilient were the graduates in the Świętokrzyskie province (1.04).
Powiats
The following four tables present the rates that describe the earnings and unemployment of the 2022 cohort graduates of master’s programmes (second-cycle programmes or long-cycle programmes) in the first year following graduation, by powiat of residence. The tables are limited to powiats with five best and five worst scores.
Table 2. Powiats with the highest and lowest earning medians of the 2022 cohort graduates of master’s programmes
| Powiat | Earning median (PLN) |
| Piaseczyński | 6,306.99 |
| Pruszkowski | 6,247.65 |
| Warszawa | 6,234.64 |
| Warszawski-zachodni | 6,172.72 |
| Grodziski | 6,110.59 |
| ... | |
| Chełmski | 4,351.40 |
| Świnoujście | 4,310.00 |
| Włoszczowski | 4,308.39 |
| Łomżyński | 4,186.20 |
| Białogardzki | 3,827.85 |
Table 3. Powiats with the highest and lowest medians of the Relative Earnings Rate of the 2022 cohort graduates of master’s programmes
| Powiat | RER median |
| Olecki | 1.02 |
| Bartoszycki | 0.99 |
| Grudziądz | 0.98 |
| Łódzki wschodni | 0.97 |
| Braniewski | 0.96 |
| ... | |
| Wołowski | 0.60 |
| Sopot | 0.57 |
| Łęczyński | 0.52 |
| Jastrzębie-Zdrój | 0.47 |
| Lubiński | 0.41 |
Table 4. Powiats with the highest and lowest values of the risk of unemployment for the 2022 cohort graduates of master’s programmes
| Powiat | Risk of unemployment |
| Wschowski | 0.00% |
| Sztumski | 0.61% |
| Otwocki | 0.71% |
| Międzychodzki | 0.74% |
| Grójecki | 0.99% |
| ... | |
| Grajewski | 10.35% |
| Sępoleński | 10.42% |
| Janowski | 10.54% |
| Przeworski | 10.77% |
| Bieszczadzki | 11.06% |
Table 5. Powiats with the highest and lowest values of the Relative Unemployment Rate for the 2022 cohort of graduates of master’s programmes
| Powiat | RUR |
| Wschowski | 0.00 |
| Sztumski | 0.11 |
| Malborski | 0.12 |
| Olecki | 0.12 |
| Górowski | 0.15 |
| ... | |
| Gorzów Wielkopolski | 1.55 |
| Łosicki | 1.56 |
| Sopot | 1.71 |
| Olsztyn | 1.74 |
| Łomżyński | 1.79 |
The data suggests that the powiats which offer the highest salaries for graduates do not always boast the highest values of the Relative Earnings Rate (RER). This can be observed in the top five highest-salary powiats, all of which are situated in the Warsaw agglomeration, where average resident incomes are high. The highest RER values are characteristic to graduates in the powiats where average resident incomes are often lower.
Likewise, a reduced risk of graduate unemployment may occur in powiats where average unemployment rates are low. In that case, the Relative Unemployment Rate (RUR) values are not particularly low. Graduates residing in powiats with high unemployment may encounter lower RUR values.
Post-graduation income changes
Figure 1 depicts the five-year trends of the Relative Earnings Rate (RER) for the 2018–2022 cohorts of graduates of master’s programmes (second-cycle programmes or long-cycle programmes).
The longest line illustrates the circumstances of the 2018 cohort during five years (sixty months) after graduation; the shortest line illustrates the circumstances of the 2022 cohort during one year (twelve months) after graduation.
Figure 1. The values of the Relative Earnings Rate during consecutive months after the graduation of the 2018–2022 students who pursued second-cycle programmes and long-cycle programmes
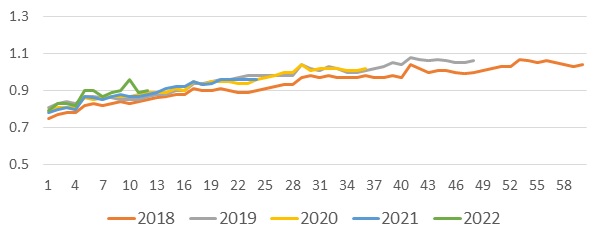
Although graduates initially earn below the average income in their powiats of residence, by the third year after graduation, earlier cohorts ‘surpass' the average income in their powiats and continue to see their salaries increase in subsequent years.
It is worth emphasizing that the upward trend indicates not just an increase in graduates' earnings over time but, more importantly, that their salaries are growing FASTER than those of individuals in their powiats of residence. Therefore, pursuing higher education is also beneficial for financial reasons — graduates perform better in the labour market compared to other local job market participants.
Which fields offer the highest earnings in the first year after graduation?
The information concerning the fields with the highest salaries is presented for graduates of master’s programmes (second-cycle or long-cycle master’s programmes), broken down by domain of study. It is important to recognise the distinct nature of various labour market strategies depending on the type of studies completed. For example, the labour market experiences of IT experts differ from those of philology graduates.
The results discussed pertain to the 2022 cohort of graduates. Earnings during the first year following graduation are presented with two indicators: the median monthly salary expressed in PLN and the Relative Earnings Rate (RER). It is important to note that the first year following graduation typically marks the beginning of a professional career. For that reason, low salaries during the first year—expressed in PLN and as RER values below 1—should not be unexpected.
Table 6 presents the results for specific domains of study.
Table 6. Earnings of the 2022 cohort of graduates of second-cycle and long-cycle master’s programmes during the first year after graduation by domain of study
| Domain of study | Earning median (PLN) | RER median |
| Medical and health sciences | 6,293.82 | 0.88 |
| Engineering and technology | 5,792.90 | 0.85 |
| Social sciences | 4,879.33 | 0.73 |
| Exact and natural sciences | 4,637.93 | 0.67 |
| Humanities | 4,435.74 | 0.63 |
| Technology | 4,069.19 | 0.62 |
| Agricultural sciences | 4,040.52 | 0.6 |
| Fine arts | 3,330.68 | 0.47 |
The average salaries of graduates in specific domains during the first year following graduation vary. Graduates in medical and health sciences boasted the highest average salaries. During the first year of their careers, they earned an average of 88% of the local average salaries in their powiats of residence. It is important to note that the salaries of graduates specialising in medical and health sciences were higher than those in the fields that are considered the most lucrative – engineering, exact and natural sciences, and social sciences.
Table 7 presents the top five programmes within each domain of study with the highest earnings during the first year following graduation. The table includes results for programmes with at least thirty graduates nationwide. The domain of theological sciences included only one programme with over thirty graduates nationwide – theology. The programmes were ranked according to the Relative Earnings Rate to ensure that results are comparable regardless of powiats of residence.
Table 7. Earnings of the 2022 cohort of graduates of second-cycle and long-cycle master’s programmes during the first year following graduation by programmes offering highest earnings
| Domain of study | Programme name | Earning median (PLN) | RER median |
| Medical and health sciences | nursery | 8,465.48 | 1.33 |
| midwifery | 7,645.24 | 1.16 | |
| pharmacy | 6,305.74 | 0.96 | |
| medicine | 6,435.22 | 0.91 | |
| electroradiology | 5,728.29 | 0.85 | |
| Engineering and technology | computer science and smart systems | 12,408.57 | 1.66 |
| applied computer and information science | 10,375.73 | 1.48 | |
| cybersecurity | 10,787.59 | 1.43 | |
| telecommunications | 10,055.18 | 1.36 | |
| information and communications technology | 9,170.76 | 1.34 | |
| Social sciences | executive master of business administration | 17,376.75 | 2.63 |
| IT management techniques | 10,999.47 | 1.51 | |
| data science and business analytics | 11,838.11 | 1.45 | |
| data analysis – big data | 9,408.66 | 1.24 | |
| quantitative methods in economics and information systems | 9,922.50 | 1.24 | |
| Exact and natural sciences | applied computer and information science | 10,164.56 | 1.37 |
| computer and information science | 7,960.49 | 1.17 | |
| applied Mathematics | 7,580.8 | 1.14 | |
| data analysis and processing | 7,487.58 | 1.07 | |
| big data analytics | 7,650.33 | 1.07 | |
| Humanities | Italian philology | 6,060.24 | 0.89 |
| German philology | 5,324.30 | 0.77 | |
| German studies | 5,703.22 | 0.76 | |
| Scandinavian studies | 6023.96 | 0.75 | |
| Polish philology for teachers | 4,907.54 | 0.74 | |
| Technology | theology | 4,190.01 | 0.63 |
| Agricultural sciences | agroforestry | 4,961.07 | 0.86 |
| forestry | 5,186.58 | 0.86 | |
| wood technology | 5,681.82 | 0.86 | |
| cosmetics technology | 4,725.69 | 0.73 | |
| agriculture | 4,438.88 | 0.71 | |
| Fine arts | instrumental music education | 4,060.04 | 0.57 |
| film and television production | 3,866.38 | 0.55 | |
| music arts education | 3,868.90 | 0.54 | |
| design | 3,788.20 | 0.54 | |
| interior architecture | 3,409.74 | 0.5 |
The salary differences between programmes are more pronounced than the differences in average salaries across specific domains. Social science graduates with degrees in executive master of business administration and data analysis were offered highest salaries. High incomes were also attained by engineering and exact and natural science graduates with various IT degrees, such as computer science and cybersecurity. The lowest salaries were recorded for the graduates who majored in arts.
ELA dispels myths and stereotypes demonstrating, for example, that degrees in social sciences offer pathways to successful careers.