
Throughout the entire five-year period after graduation, graduates' earnings have been growing steadily and their unemployment rate has been falling, as revealed by the results of the latest editions of data analysis performed by the Polish Graduate Tracking System (the ELA system). However, this trend is less pronounced in some areas of academic study.
Over the last five years, the Polish Graduate Tracking System (the ELA system) has completed its first full research cycle. It is precisely five years after graduation that, according to the "Constitution for Science" act (i.e. the Act on Higher Education and Science which entered into force on 1 October 2018), the situation of graduates of particular areas of academic study is monitored. For those who graduated in 2014, this period has just finished, and we are now able to take a closer look at the dynamics of their labour market situation stretching over the full 5-year period. The observations presented here can also be extended to other age groups of graduates. The comparisons of results for different age groups we have conducted so far show that, in general, subsequent age groups perform very similarly over the same period of time after graduation.
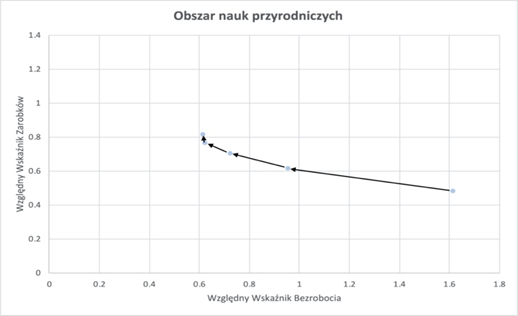
The graphs below present the characteristics of the situation of graduates in the years following graduation according to two basic indicators: the Relative Earnings Index (REI) and the Relative Unemployment Index (RUI). These indices refer graduates’ level of earnings and risk of unemployment to the current situation on their local labour markets (in their poviats of residence). This allows for a reliable comparison of graduates' achievements, despite fluctuations in wages and unemployment rates, and despite their regional variation.
|
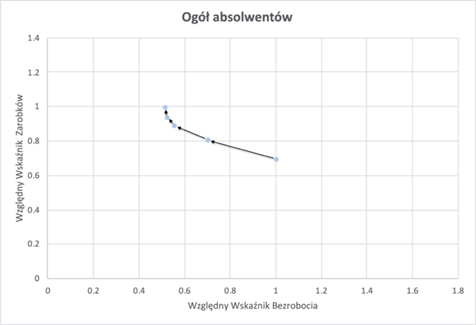
The figure above shows the dynamics of the index of earnings (vertical axis) and the index of unemployment (horizontal axis). The points on the graph illustrate the situation of graduates in the years following graduation, while the arrows show the flow from the first to the fifth year after graduation. A relatively better situation on the labour market is evidenced by higher values of the REI and lower values of the RUI, so the closer the curve is to the upper left corner of the graph, the better.
Throughout the entire five-year period, we can observe a noticeable improvement in the situation of graduates in terms of both indices year on year: their earnings rise and the level of unemployment in the cohort decreases.
What is more, the growth of the REI reveals that during this period the earnings of graduates grew faster than the average earnings in their poviats, and a decrease in the RUI shows that the level of unemployment among the 2014 graduates decreased at a faster rate than that of the local labour markets. The starting salary of graduates is not very high: in the first year after graduation the average graduate earns less than 70% of the average local salary. In the first years after graduation the economic situation of graduates improves quickly, but over time the speed of improvement decreases as their position on the labour market stabilises. The initial salary gap is rapidly reduced.
Five years after graduation, the average graduate has managed to catch up with his average neighbour and earns the average wage in his/her place of residence. However, graduates do not constitute a uniform cohort. The degree programme which the graduate pursued is of key importance for his/her future success on the labour market.
Graduates of different fields of study work on different sections of the labour market and rarely compete with each other for the same jobs. In order to obtain a more complete picture, it is necessary to look at the economic situation of graduates from different academic areas of study separately. Doing so will allow us to formulate three main conclusions.
|
|
|
|
|
|
|
|
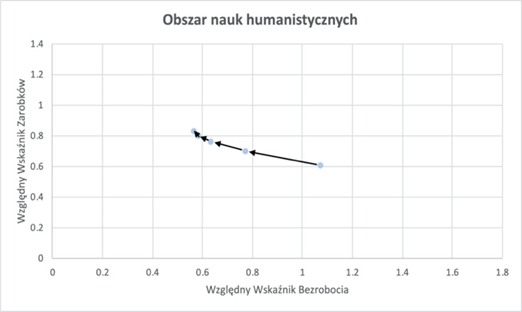
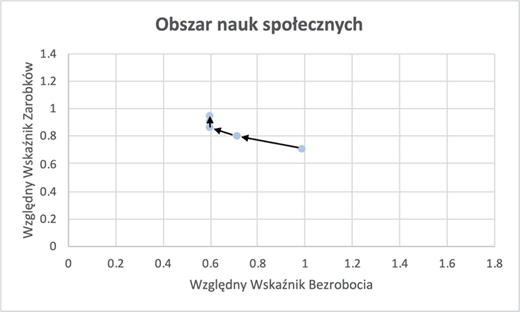
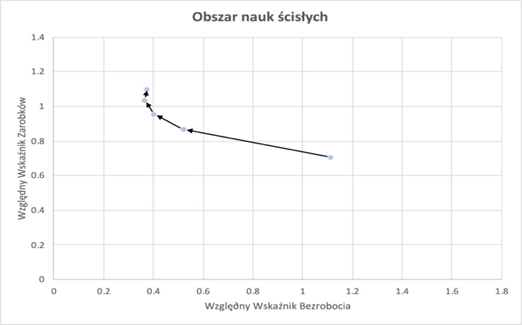
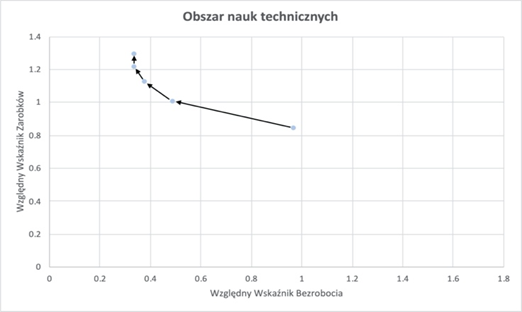
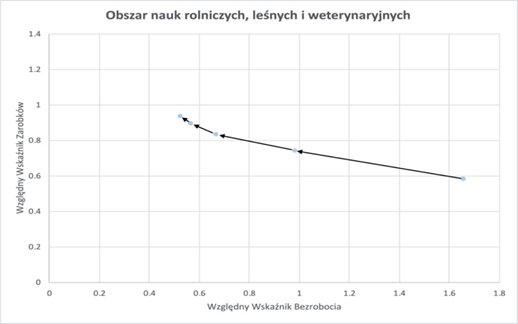
Firstly, graduates from different groups of fields of study may find themselves in clearly different situations on the labour market. For example, graduates from technological degree programmes enjoy higher earnings and lower unemployment risk than graduates of degree programmes in the areas of natural sciences or humanities. The situation of graduates representing particular areas of study can be assessed on the basis of a series of graphs presented above – the closer a point on the curve is to the upper left corner of the graph, the better the situation of the particular group of graduates on the labour market.
Secondly, over the 5 years since graduation, graduates from all areas of academic study have experienced an improvement in their labour market situation, but graduates from some areas have experienced a more significant improvement than others. The table below shows the differences between the situation of graduates representing different areas of study in the first and fifth year after graduation.
| Area of academic study | RUI | REI |
|---|---|---|
| Technological sciences | -0.63 | 0.45 |
|
Medical, health and sport sciences |
-0.35 | 0.42 |
| Science | -0.74 | 0.39 |
| Agricultural, forestry and veterinary sciences | -1.13 | 0.35 |
| Biological sciences | -1 | 0.33 |
| Social studies | -0.39 | 0.24 |
| Humanities | -0.51 | 0.22 |
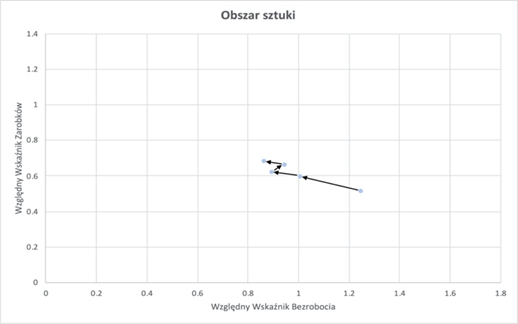
| The Arts | -0.38 | 0.17 |
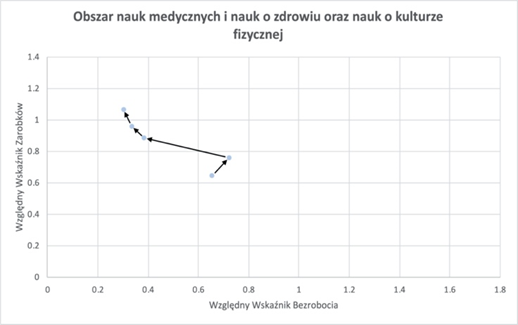
As can be seen, the greatest increase in earnings (45% of the local average) was enjoyed by graduates of technological sciences (who were among the highest earners in the cohort from the beginning), while the smallest increase was recorded by graduates of the arts (17% of the local average). As regards unemployment, the greatest improvement was recorded by graduates of agricultural, forestry, and veterinary sciences, while the smallest drop in unemployment was recorded among graduates of medical, health and sport sciences, and graduates of the arts. It is worth pointing out that graduates of medical, health and sport sciences enjoyed the lowest level of unemployment of all groups from the very beginning of the period under study. Consequently, a significant decrease in the level of unemployment in this group was not possible. In the case of graduates of degree programmes from the academic area of the arts, not only was the unemployment rate among the highest ones in the analysed cohort, but it also decreased only slightly in the period under study.
Thirdly, in the case of graduates of most areas of academic study, we can observe a very similar pattern of change dynamics, which is evidenced by the similar shapes of the curves for individual areas of academic study. In general, we see a rapid decline in unemployment in the initial period, followed by a much slower decrease towards the end of the studied period, as well as a systematic (yet weakening over time) growth of earnings. However, two groups of graduates are an exception to this general observation: graduates of medical, health and sport sciences as well as graduates of the arts.
A large proportion of medical science graduates are young doctors. We have devoted a separate paper to their situation on the labour market. Young doctors register en masse as unemployed in the short period of time between their professional internship and obtaining a permanent right to practice as a doctor. The status of an unemployed person provides young doctors with health insurance during this transitional period which coincides with the second year after graduation, so the second point on the graph is shifted to the right. It is worth noting that the increase in earnings among medical science graduates is one of the fastest salary growths in the cohort under study – only graduates of technical sciences enjoy a higher rate of salary growth.
Among graduates of the arts, the relatively slow salary growth is accompanied by irregular changes in unemployment levels. These changes deviate from the pattern observed for the other graduates: the initial reduction in the level of unemployment is followed by a phase unmarked by any clear trend. This may be a consequence of the different ways of finding one’s spot on the labour market, which is widespread in this group.
Graduates of degree programmes in the academic area of the arts undertake casual (part-time) work at the expense of full-time work more frequently than other graduates. The percentage of people employed on temporary or part-time contracts rather than full-time contracts remains stable in this group (about 17%), a larger proportion than in the other groups of graduates (but after five years the percentage drops to 9%). In a similar vein, the proportion of people employed on the basis of permanent full-time contracts five years after graduation turns out to be significantly lower among graduates of the arts (54%) than among graduates of other areas of academic study (75%). Furthermore, the fact that graduates of the arts undertake precarious forms of employment also leads to a greater propensity to periodically register as unemployed.