
The professional careers of graduates and dropouts
Data from the Polish Graduate Tracking System (ELA) suggests that degrees are highly valued in the labour market. Graduates often have more professional experience, are less likely to become unemployed, and enjoy considerably higher incomes than those without degrees.
ELA's newest functionality monitors the economic circumstances not only of graduates, but also of current students and dropouts. In the 7th edition of the ELA system, we analysed circumstances in the labour market from the perspectives of graduates and dropouts. The comparison included graduates who had not begun or pursued other study programmes and who had decided not to study in doctoral schools or pursue PhD programmes. The analysis pertained to the economic circumstances at the end of 2021 of individuals who began their studies in 2016. The results included first- and second-cycle programmes. The situation differed somewhat among individuals who began long-cycle programmes in 2016; most of them completed their studies in 2021 and had not gained any work experience.
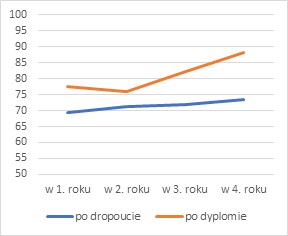
If we compare the graduates and dropouts who commenced their first or second cycle programmes in 2016, we immediately notice that the former group have gained substantially more work experience, as presented in Figure 1.
Figure 1. The percentage of individuals with any work experience: graduates vs. dropouts.
First-cycle programmes
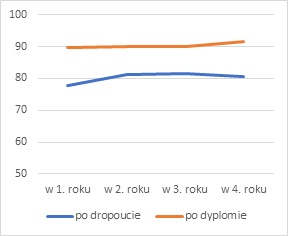
 Second-cycle programmes
 Source: ELA
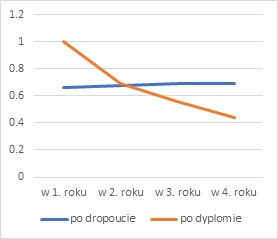
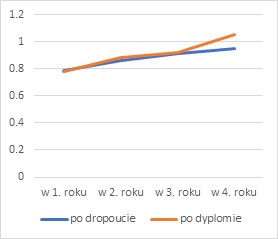
First-cycle graduates impressive performance in the labour market is evidenced by the relative unemployment (RUR) and relative earnings (RER) rates. Despite the first-cycle graduates being more exposed to unemployment in the two years following their graduation, the RUR for this group is markedly lower than that for dropouts in the third and consecutive years. The RER for graduates is higher even in the first year following their graduation; in the third and fourth years, graduates earn almost twice as much as dropouts.
Figure 2. Relative labour market rates: first-cycle graduates vs. first-cycle dropouts.
Relative unemployment rate
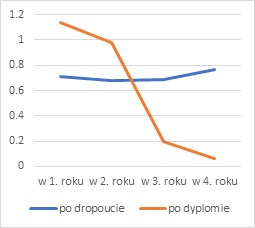 Relative earnings rate
 Source: ELA
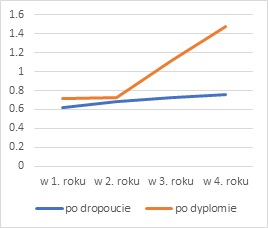
Less significant differences could be observed among individuals who pursued second-cycle programmes—although graduates remained better positioned. Although the risk of unemployment in that group is higher in the first year following graduation, it lowers considerably during the second year. In the first three years following graduation, graduates' and dropouts' earnings are similar; in the fourth year, however, graduates earn slightly more than those who opted to discontinue their studies (Figure 3).
Figure 3. Relative labour market rates: second-cycle graduates vs. second-cycle dropouts.
Relative unemployment rate
 Relative earnings rate
 Source: ELA
Graduates are less likely than dropouts to become unemployed over time
Table 1 presents the RURs for first-cycle graduates and dropouts. The risk of becoming unemployed by domain of study is substantially lower among graduates—particularly in the third and consecutive years following graduation.
Table 1. The relative unemployment rate: first-cycle graduates vs. first-cycle dropouts by domain of study
| Względny Wskaźnik Bezrobocia | |||||
|---|---|---|---|---|---|
| w 1. roku | w 2. roku | w 3. roku | w 4. roku | ||
| Dziedzina nauk humanistycznych | po dropoucie | 0.75 | 0.8 | 0.85 | 0.94 |
| po dyplomie | 1.18 | 0.92 | 0.49 | - | |
| Dziedzina nauk inżynieryjno-technicznych | po dropoucie | 0.71 | 0.59 | 0.57 | 0.64 |
| po dyplomie | 1.02 | 1.02 | - | - | |
| Dziedzina nauk medycznych i nauk o zdrowiu | po dropoucie | 0.81 | 0.77 | 0.87 | 0.94 |
| po dyplomie | 1.27 | 1.04 | 0 | 0.05 | |
| Dziedzina nauk rolniczych | po dropoucie | 0.97 | 0.79 | 0.86 | 0.98 |
| po dyplomie | 1.32 | 0.93 | - | - | |
| Dziedzina nauk ścisłych i przyrodniczych | po dropoucie | 0.65 | 0.52 | 0.52 | 0.57 |
| po dyplomie | 0.98 | 0.94 | 0 | - | |
| Dziedzina nauk społecznych | po dropoucie | 0.67 | 0.68 | 0.68 | 0.77 |
| po dyplomie | 1.1 | 0.93 | 0.54 | - | |
| Dziedzina sztuki | po dropoucie | 0.86 | 0.9 | 1.08 | 1.09 |
| po dyplomie | 1.55 | 1.7 | - | - | |
NOTE: some domains had fewer than twenty graduates; in such instances, the values have been replaced with hyphens. Source: ELA
Similar tendencies were observed among students of second-cycle programmes. The risk of becoming unemployed is lower for graduates by the second or third year following graduation. Exceptions to this general rule include arts and exact and natural sciences programmes.
Table 2. The relative unemployment rate: second-cycle graduates vs. second-cycle dropouts by domain of study
| Względny Wskaźnik Bezrobocia | |||||
|---|---|---|---|---|---|
| w 1. roku | w 2. roku | w 3. roku | w 4. roku | ||
| Dziedzina nauk humanistycznych | po dropoucie | 0.74 | 0.77 | 0.92 | 1 |
| po dyplomie | 1.09 | 0.91 | 0.73 | - | |
| Dziedzina nauk inżynieryjno-technicznych | po dropoucie | 0.55 | 0.52 | 0.49 | 0.51 |
| po dyplomie | 0.97 | 0.49 | 0.42 | 0.38 | |
| Dziedzina nauk medycznych i nauk o zdrowiu | po dropoucie | 0.66 | 0.73 | 0.84 | 0.8 |
| po dyplomie | 0.8 | 0.55 | 0.46 | 0 | |
| Dziedzina nauk rolniczych | po dropoucie | 0.73 | 0.81 | 0.75 | 0.68 |
| po dyplomie | 1.61 | 1.07 | 0.69 | 0.64 | |
| Dziedzina nauk ścisłych i przyrodniczych | po dropoucie | 0.74 | 0.77 | 0.57 | 0.46 |
| po dyplomie | 1.42 | 0.77 | 0.57 | 0.57 | |
| Dziedzina nauk społecznych | po dropoucie | 0.65 | 0.7 | 0.7 | 0.72 |
| po dyplomie | 0.93 | 0.69 | 0.59 | 0.42 | |
| Dziedzina sztuki | po dropoucie | 1.3 | 1.04 | 0.93 | 0.57 |
| po dyplomie | 1.62 | 1.49 | 1.03 | 1 | |
NOTE: some domains of study had fewer than twenty graduates; in such instances, the values have been replaced with hyphens. Source: ELA
Graduates with first-cycle degrees earn more than dropouts over time; no significant differences were observed, however, between second-cycle graduates and dropouts.
First-cycle graduates with degrees in any domain earn more than first-cycle dropouts in the first and consecutive years after graduation/dropout. An exception to this rule is arts—a domain in which the earnings of both groups are similar (Table 3).
Table 3. The relative earnings rate: first-cycle graduates vs. first-cycle dropouts by domain of study
| Względny Wskaźnik Zarobków | |||||
|---|---|---|---|---|---|
| w 1. roku | w 2. roku | w 3. roku | w 4. roku | ||
| Dziedzina nauk humanistycznych | po dropoucie | 0.59 | 0.68 | 0.72 | 0.75 |
| po dyplomie | 0.62 | 0.7 | 0.71 | - | |
| Dziedzina nauk inżynieryjno-technicznych | po dropoucie | 0.69 | 0.76 | 0.81 | 0.83 |
| po dyplomie | 0.88 | 1.07 | - | - | |
| Dziedzina nauk medycznych i nauk o zdrowiu | po dropoucie | 0.52 | 0.6 | 0.63 | 0.67 |
| po dyplomie | 0.62 | 0.76 | 1.32 | 1.55 | |
| Dziedzina nauk rolniczych | po dropoucie | 0.55 | 0.62 | 0.67 | 0.69 |
| po dyplomie | 0.62 | 0.6 | - | - | |
| Dziedzina nauk ścisłych i przyrodniczych | po dropoucie | 0.63 | 0.74 | 0.81 | 0.87 |
| po dyplomie | 0.7 | 0.72 | 1.01 | - | |
| Dziedzina nauk społecznych | po dropoucie | 0.61 | 0.66 | 0.69 | 0.72 |
| po dyplomie | 0.71 | 0.73 | 0.85 | - | |
| Dziedzina sztuki | po dropoucie | 0.5 | 0.55 | 0.61 | 0.62 |
| po dyplomie | 0.49 | 0.54 | - | - | |
NOTE: some domains of study had fewer than twenty graduates; in such instances, the values have been replaced with hyphens. Source: System ELA
In the majority of domains, the earnings of second-cycle graduates and second-cycle dropouts are similar; in medical and health sciences, however, graduates earn considerably more than dropouts (Table 4). It should also be noted that second-cycle dropouts already have first-cycle degrees. This means that they have already obtained some tertiary education, which the labour market values more than secondary education.
Table 4. The relative earnings rate: second-cycle graduates vs. second-cycle dropouts by domain of study
| Względny Wskaźnik Zarobków | |||||
|---|---|---|---|---|---|
| w 1. roku | w 2. roku | w 3. roku | w 4. roku | ||
| Dziedzina nauk humanistycznych | po dropoucie | 0.69 | 0.75 | 0.8 | 0.84 |
| po dyplomie | 0.67 | 0.76 | 0.79 | - | |
| Dziedzina nauk inżynieryjno-technicznych | po dropoucie | 0.97 | 1.07 | 1.13 | 1.17 |
| po dyplomie | 0.91 | 1.06 | 1.12 | 1.11 | |
| Dziedzina nauk medycznych i nauk o zdrowiu | po dropoucie | 0.66 | 0.7 | 0.75 | 0.76 |
| po dyplomie | 0.77 | 0.84 | 0.94 | 1.1 | |
| Dziedzina nauk rolniczych | po dropoucie | 0.67 | 0.73 | 0.79 | 0.83 |
| po dyplomie | 0.65 | 0.78 | 0.83 | 0.82 | |
| Dziedzina nauk ścisłych i przyrodniczych | po dropoucie | 0.81 | 0.88 | 0.97 | 1.02 |
| po dyplomie | 0.73 | 0.86 | 0.92 | 1.04 | |
| Dziedzina nauk społecznych | po dropoucie | 0.77 | 0.83 | 0.86 | 0.9 |
| po dyplomie | 0.77 | 0.84 | 0.86 | 0.96 | |
| Dziedzina sztuki | po dropoucie | 0.52 | 0.58 | 0.58 | 0.61 |
| po dyplomie | 0.52 | 0.57 | 0.63 | 0.62 | |
Source: ELA
The data also suggests that, in some respects, individuals who decide to discontinue their education at the most prestigious universities perform better in the labour market than graduates. It is important to note, however, that the monitoring period is rather short and those who drop out of university to pursue more profitable jobs typically fare well in the early years of their careers. Although they have failed to obtain a degree, they rely on the prestige of their higher education institutions and on the knowledge and skills acquired during their studies.